
Introduction
ANAQUANT has developed an innovative standard dedicated to MS-based Host Cell Protein (HCP) profiling analysis: HCPprofiler. This solution is composed by both (1) a hydro-soluble bead coated with 54 peptides based on the READYBEADS technology which, after being spiked directly into the sample, releases peptides at well controlled concentration to obtain a robust and universal calibration curve; and (2) a dedicated software to convert MS signals into amount of each identified protein. The HCPprofiler standard was developed according to the top 3 principle (Silva et al., 2006) to have a global strategy implementable to any biologic sample. TOP3 principle makes the assumption that, at equivalent molar concentration, the sum of MS signal for the 3 best peptides is similar, whatever the considered protein. Thus, by reporting the TOP3 signal of any HCP against the calibration curve, it makes possible to accurately and individually assess concentration of HCP present into the therapeutics. The developed HCPprofiler solution allows identification and quantification of HCPs whatever the downstream process step with high reproducibility and robustness. Furthermore, peptides used in HCPprofiler standard are non-natural and will not be find on any databases. That’s why HCPprofiler standard can be added to any cellular model and can be considered as a universal calibration curve.
It represents a technical solution for batches comparison (consistency) and downstream process performance studies regarding HCP removal through time without any specific development.
In this application note we performed a method cross validation by comparing the protein quantification obtained the HCPprofiler solution to those obtained using an LC-MS/MS targeted method in SRM (Selected Reaction Monitoring) mode.
Results
Cross validation is a comparison of data from at least two different analytical methods (reference method and test method) or from the same method used by at least two different laboratories (reference site and test site) within the same study. The goal is to determine whether the obtained data are comparable.
Here, the reference method used was a SRM targeted LC-MS/MS method using labeled peptides as proteins specific standards for absolute proteins quantification. This method is to date the gold standard for protein quantification by mass spectrometry. Here, the targeted method used is focused on 82 peptides representative of 74 critical HCPs that were extracted from an in-house HCP database and other knowledge obtained from the literature, including the immunogenic PLBL2 lipase, the HTRA1 protease and the BIP proteins.
The analysis of two kind of samples, a purification intermediate and a DS, allows to perform comparison on different datasets sizes.
On the middle purification step of a therapeutic protein more than 200 CHO host cell proteins HCPs were simultaneously identified and quantified using the HCPprofiler solution. Among those proteins, 59 correspond to HCPs that were also screened by the gold standard SRM method (Figure 1).
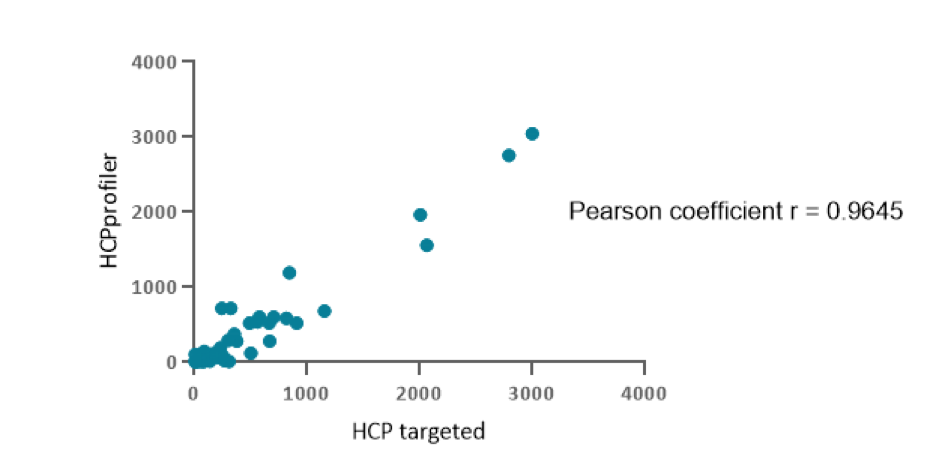
Figure 1 : Correlation between HCPs ppm quantity measured using HCPprofiler method (ordinate axis) or SRM method (abscissa axis)
The figure represents the correlation of measured HCP quantities depending on the method used. Pearson coefficient showed a strong positive correlation (r = 0.9407–0.9788; p <0.05). It means that HCPprofiler quantification method is comparable to the gold standard method for protein quantification in LC-MS/MS.
On the drug substance sample of a purified protein from CHO cells, 6 proteins simultaneously identified and quantified by the HCPprofiler method were also screened using the gold standard SRM method (Figure 2).
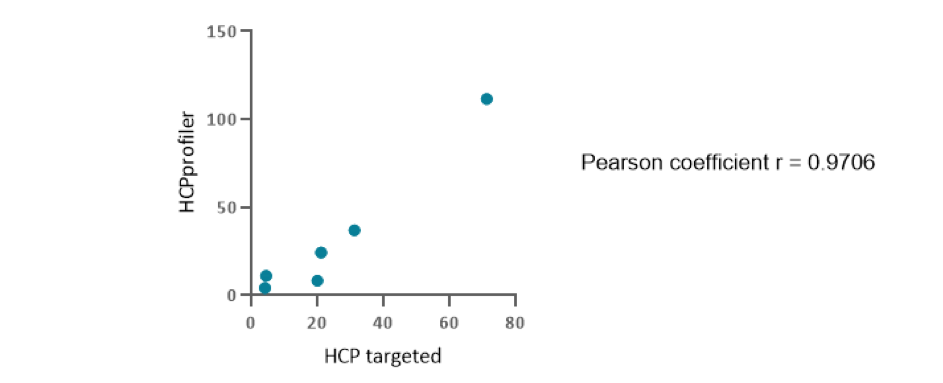
Figure 2 : Correlation between HCPs ppm quantity measured using HCPprofiler method (ordinate axis) or SRM method (abscissa axis)
The figure represents the correlation of measured HCP quantities depending on the method used. Pearson coefficient showed a strong positive correlation (r =0.7491 – 0.9969; p <0.05). It means that HCPprofiler quantification method is comparable to the gold standard method for protein quantification in LC-MS/MS in drug substance.
Conclusion
Besides the protein identification capability provided by the use of HCPprofiler solution, the resulting HCPs quantification showed a strong correlation with the results obtained using absolute quantification based on proteins specific standards, meaning that the HCPprofiler is a relevant tool for HCPs concentration measurement all along the DSP.
HCPprofiler solution may enable comprehensive and rather accurate measurement of HCP quantity in different type of samples, thereby providing an advantage over semi-blinded targeted analysis.