
Introduction
Amino acids are found throughout the body as they are the basic structural units that build proteins. Amino acids in serum have recently emerged as biomarkers for diagnostic purposes. Indeed, some disorders result in the accumulation or the deficiency of 1 or more amino acids in biological fluids such as serum. In addition, recent studies introduce amino acid profiling data as a potential new “omics” input into the metabolomics subset, to further investigate interaction networks.
Here we describe the analysis of 41 amino acids in serum by LC-MS/MS, with the aim of validating this method’s accuracy and robustness in our laboratory.
LC-SRM Analytical Strategy
We used a combination of solvents to extract amino acids from small samples of 25µl of serum. Then, we performed targeted LC-MS/MS analysis by LC-SRM (Selected Reaction Monitoring) on a triple quadrupole mass spectrometer. The precursor ion corresponding to an amino acid is first selected in the Q1 quadrupole, then fragmented in the Q2 collision cell. Specific fragment ions are selected in the Q3 quadrupole (Figure 1). The precursor ion/fragment ion pair is called a SRM “transition” and provides specificity and sensitivity to the quantitative analysis.
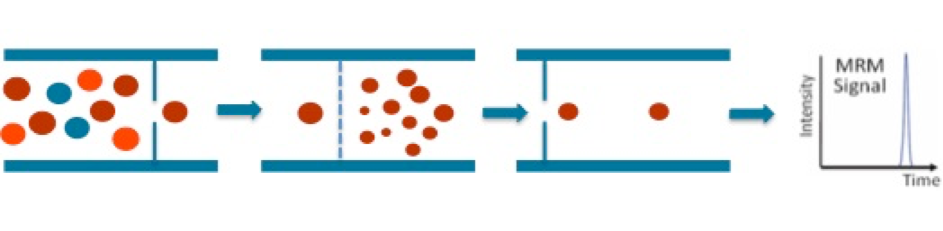
Figure 1 : Schematic diagram of Selected Reaction Monitoring
The multiplex capabilities of SRM make it the method of choice for the simultaneous analysis of 41 amino acids (Table 1) and their corresponding internal standards. Quantitative and qualitative detection was achieved for all compounds.
| 1-Methylhistidine | Glycine | 4-Hydroxyproline | Proline | Arginine |
| alpha-Aminobutyric acid | Isoleucine | Carnosine | Tryptophane | |
| Alanine | Lysine | gamma-Aminobutyric acid | Argininosuccinic acid | |
| Allo-Isoleucine | Sarcosine | Homocitrulline | Glutamic acid | |
| Asparagine | Valine | Methionine | Threonine | |
| Glutamine | beta-Alanine | Phenylalanine | Tyrosine | |
| Histidine | Citrulline | Phosphoethanolamine | Cystathionine | |
| Phosphoserine | Cystine | 3-Methylhistidine | Ethanolamine | |
| Taurine | Hydroxylysine | alpha-Aminoadipic acid | Ornithine | |
| beta-Aminoisobutyric acid | Leucine | Anserine | Serine |
Table 1 : 41 amino acids screened by LC-SRM
Results
The following chromatogram shows data obtained for the screening of 41 amino acids in serum by rapid solvent extraction followed by quantitative LC-SRM.
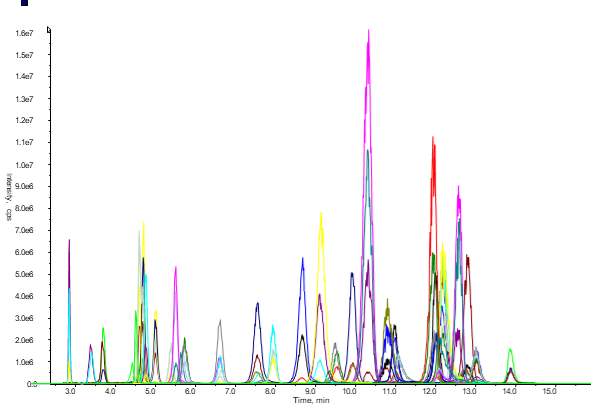
Figure 2: Chromatogram of all 41 screened components
Mass spectrometry is an analytical technique that measures the mass-to-charge ratio (m/z) of ions. The specificity of the MS targeted analysis allows qualitative and quantitative analysis. Regarding amino acid profiling, spectrophotometric detectors were previously used but were unable to discriminate components with very similar retention time. LC-SRM mass spectrometry, on the other hand, is able to discriminate between leucine and isoleucine molecule fragment despite their equivalent mass and very similar retention time (Figure 3).
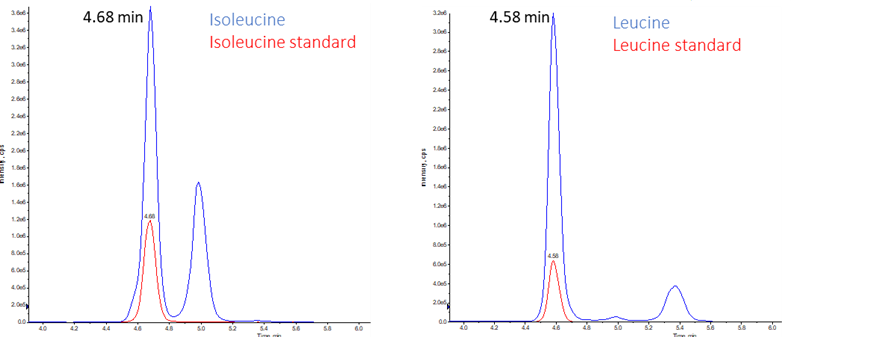
Figure 3 : example of isoleucine (top) and leucine (bottom) extracted chromatograms in serum
Internal standards corresponding to labeled heavy amino acids (in red) are used to validate peak retention times.
To evaluate the accuracy and the robustness of our method for amino acids analysis in serum sample, we determined inter-assay precision and accuracy for the 41 components. Two quality controls (QCs) were performed for each serum component (from 2 distinct serum samples), twice a day for 5 days (10 points for each component). The obtained accuracy parameters are listed in the tables below and summarized on figure 4:
| QC 1 | ||||||
| Component Name | Theoretical Concentration (µg/ml) | Num. Values | Mean | Standard deviation | CV % | Accuracy |
| 1-Methylhistidine | 0.65 | 10 of 10 | 0.69 | 0.03 | 4.1 | 105.6 |
| alpha-Aminobutyric acid | 0.98 | 10 of 10 | 1.03 | 0.04 | 3.5 | 105.0 |
| Alanine | 25.30 | 10 of 10 | 26.24 | 0.86 | 3.3 | 103.7 |
| Allo-Isoleucine | 1.68 | 10 of 10 | 1.76 | 0.07 | 4.2 | 104.6 |
| Asparagine | 7.79 | 10 of 10 | 8.23 | 0.38 | 4.6 | 105.7 |
| Glutamine | 80.10 | 10 of 10 | 86.14 | 4.11 | 4.8 | 107.5 |
| Histidine | 10.20 | 10 of 10 | 10.55 | 0.60 | 5.7 | 103.4 |
| Phosphoserine | 1.69 | 10 of 10 | 1.78 | 0.08 | 4.7 | 105.3 |
| Taurine | 9.90 | 10 of 10 | 10.40 | 0.43 | 4.2 | 105.0 |
| beta-Aminoisobutyric acid | 0.71 | 10 of 10 | 0.73 | 0.03 | 4.8 | 103.3 |
| Arginine | 7.56 | 10 of 10 | 7.70 | 0.51 | 6.6 | 101.9 |
| Cystathionine | 1.93 | 10 of 10 | 2.08 | 0.12 | 5.6 | 107.8 |
| Ethanolamine | 1.27 | 10 of 10 | 1.34 | 0.08 | 5.9 | 105.2 |
| Glycine | 25.90 | 10 of 10 | 26.34 | 1.27 | 4.8 | 101.7 |
| Isoleucine | 6.15 | 10 of 10 | 6.34 | 0.21 | 3.4 | 103.1 |
| Lysine | 8.37 | 10 of 10 | 8.51 | 0.51 | 5.9 | 101.7 |
| Sarcosine | 0.66 | 10 of 10 | 0.69 | 0.02 | 3.2 | 103.9 |
| Valine | 14.20 | 10 of 10 | 14.55 | 0.46 | 3.1 | 102.5 |
| beta-Alanine | 1.59 | 10 of 10 | 1.69 | 0.06 | 3.6 | 106.4 |
| Citrulline | 4.01 | 10 of 10 | 4.09 | 0.22 | 5.4 | 101.9 |
| Cystine | 3.31 | 10 of 10 | 3.44 | 0.32 | 9.4 | 104.0 |
| Hydroxylysine | 1.21 | 10 of 10 | 1.24 | 0.04 | 3.3 | 102.8 |
| Leucine | 15.30 | 10 of 10 | 16.23 | 0.68 | 4.2 | 106.1 |
| Serine | 18.60 | 10 of 10 | 19.62 | 0.64 | 3.2 | 105.5 |
| Threonine | 10.10 | 10 of 10 | 10.72 | 0.47 | 4.4 | 106.2 |
| Tyrosine | 10.20 | 10 of 10 | 10.91 | 0.52 | 4.8 | 107.0 |
| 4-Hydroxyproline | 1.95 | 10 of 10 | 2.04 | 0.09 | 4.7 | 104.5 |
| Carnosine | 1.70 | 10 of 10 | 1.77 | 0.06 | 3.6 | 104.1 |
| gamma-Aminobutyric acid | 0.49 | 10 of 10 | 0.51 | 0.04 | 8.3 | 103.1 |
| Homocitrulline | 2.89 | 10 of 10 | 3.01 | 0.10 | 3.3 | 104.2 |
| Methionine | 2.67 | 10 of 10 | 2.79 | 0.07 | 2.7 | 104.4 |
| Phenylalanine | 21.60 | 10 of 10 | 22.33 | 1.05 | 4.7 | 103.4 |
| Phosphoethanolamine | 1.54 | 10 of 10 | 1.62 | 0.10 | 6.2 | 105.1 |
| 3-Methylhistidine | 2.01 | 10 of 10 | 2.12 | 0.08 | 3.7 | 105.6 |
| alpha-Aminoadipic acid | 0.87 | 10 of 10 | 0.91 | 0.04 | 4.3 | 104.9 |
| Anserine | 1.09 | 10 of 10 | 1.12 | 0.05 | 4.2 | 102.7 |
| Argininosuccinic acid | 3.10 | 10 of 10 | 3.71 | 0.65 | 17.5 | 119.8 |
| Glutamic acid | 14.70 | 10 of 10 | 16.03 | 0.96 | 6.0 | 109.0 |
| Ornithine | 7.24 | 10 of 10 | 7.48 | 0.33 | 4.4 | 103.3 |
| Proline | 16.80 | 10 of 10 | 17.49 | 0.87 | 5.0 | 104.1 |
| Tryptophane | 5.77 | 10 of 10 | 6.28 | 0.52 | 8.3 | 108.9 |
| QC 2 | ||||||
| Component Name | Theoretical Concentration (µg/ml) | Num. Values | Mean | Standard deviation | CV % | Accuracy |
| 1-Methylhistidine | 1.73 | 10 of 10 | 1.84 | 0.07 | 3.7 | 106.1 |
| alpha-Aminobutyric acid | 5.19 | 2 of 2 | 5.37 | 0.19 | 3.6 | 103.5 |
| Alanine | 69.70 | 2 of 2 | 71.87 | 2.22 | 3.1 | 103.1 |
| Allo-Isoleucine | 11.40 | 2 of 2 | 11.94 | 0.45 | 3.7 | 104.7 |
| Asparagine | 21.50 | 2 of 2 | 22.67 | 1.20 | 5.3 | 105.5 |
| Glutamine | 183.00 | 2 of 2 | 192.94 | 6.79 | 3.5 | 105.4 |
| Histidine | 28.70 | 2 of 2 | 30.05 | 1.77 | 5.9 | 104.7 |
| Phosphoserine | 8.12 | 2 of 2 | 8.50 | 0.19 | 2.2 | 104.7 |
| Taurine | 34.50 | 2 of 2 | 35.67 | 1.03 | 2.9 | 103.4 |
| beta-Aminoisobutyric acid | 2.38 | 2 of 2 | 2.46 | 0.11 | 4.4 | 103.5 |
| Arginine | 27.50 | 2 of 2 | 27.84 | 1.44 | 5.2 | 101.2 |
| Cystathionine | 6.54 | 2 of 2 | 6.61 | 0.43 | 6.6 | 101.1 |
| Ethanolamine | 7.43 | 2 of 2 | 7.82 | 0.28 | 3.6 | 105.2 |
| Glycine | 63.60 | 2 of 2 | 66.19 | 2.19 | 3.3 | 104.1 |
| Isoleucine | 26.00 | 2 of 2 | 26.71 | 0.84 | 3.2 | 102.7 |
| Lysine | 46.50 | 2 of 2 | 49.09 | 2.11 | 4.3 | 105.6 |
| Sarcosine | 1.89 | 2 of 2 | 1.98 | 0.07 | 3.8 | 104.8 |
| Valine | 43.20 | 2 of 2 | 44.73 | 1.41 | 3.2 | 103.5 |
| beta-Alanine | 5.33 | 2 of 2 | 5.63 | 0.21 | 3.7 | 105.5 |
| Citrulline | 19.10 | 2 of 2 | 19.45 | 0.86 | 4.4 | 101.8 |
| Cystine | 20.20 | 2 of 2 | 20.86 | 2.79 | 13.4 | 103.3 |
| Hydroxylysine | 3.43 | 2 of 2 | 3.60 | 0.12 | 3.3 | 105.0 |
| Leucine | 48.80 | 2 of 2 | 50.67 | 1.14 | 2.2 | 103.8 |
| Serine | 47.30 | 2 of 2 | 48.90 | 1.69 | 3.5 | 103.4 |
| Threonine | 35.30 | 2 of 2 | 37.23 | 1.20 | 3.2 | 105.5 |
| Tyrosine | 33.60 | 2 of 2 | 35.82 | 1.48 | 4.1 | 106.6 |
| 4-Hydroxyproline | 11.90 | 2 of 2 | 12.40 | 0.42 | 3.4 | 104.2 |
| Carnosine | 5.00 | 2 of 2 | 5.23 | 0.27 | 5.2 | 104.7 |
| gamma-Aminobutyric acid | 1.18 | 2 of 2 | 1.28 | 0.09 | 7.3 | 108.4 |
| Homocitrulline | 7.01 | 2 of 2 | 7.31 | 0.39 | 5.4 | 104.2 |
| Methionine | 12.80 | 2 of 2 | 13.35 | 0.83 | 6.2 | 104.3 |
| Phenylalanine | 67.10 | 2 of 2 | 69.71 | 2.24 | 3.2 | 103.9 |
| Phosphoethanolamine | 9.29 | 2 of 2 | 9.59 | 0.89 | 9.3 | 103.3 |
| 3-Methylhistidine | 8.89 | 2 of 2 | 9.21 | 0.33 | 3.6 | 103.6 |
| alpha-Aminoadipic acid | 2.11 | 2 of 2 | 2.19 | 0.07 | 3.3 | 103.8 |
| Anserine | 2.63 | 2 of 2 | 2.73 | 0.14 | 5.1 | 103.8 |
| Argininosuccinic acid | 19.90 | 1 of 2 | 22.20 | 2.88 | 13.0 | 111.6 |
| Glutamic acid | 63.00 | 2 of 2 | 66.10 | 2.68 | 4.1 | 104.9 |
| Ornithine | 30.20 | 2 of 2 | 31.34 | 1.38 | 4.4 | 103.8 |
| Proline | 48.80 | 2 of 2 | 50.97 | 2.45 | 4.8 | 104.4 |
| Tryptophane | 24.90 | 2 of 2 | 27.82 | 2.53 | 9.1 | 111.7 |
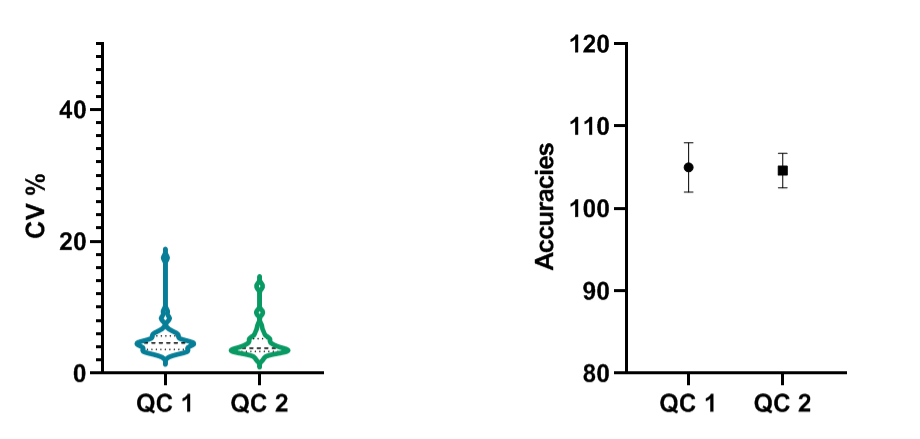
Figure 4: Median accuracy (Right) of QC1 (n = 10) and QC2 (n = 2) as to the concentration of 41 amino acids in serum (100* experimental conc. / theoretical conc.) , and the related Coefficients of Variation (CV in %)
Coefficients of Variation (CVs) remain well below 20% for both QCs and all 41 compounds (5 days and two sessions per day) (the maximal value is 13.4%). The mean CV is 4.6% and 3.8% for both QCs, respectively. Our method tends to slightly overestimate amino acid concentrations; the mean accuracy is 104.5 and 104.2 for both QCs, respectively. Overall, accuracy and precision results validate LC-MS for the profiling of these 41 amino acids in serum.
Concluding remark
Amino acid profiling of biological samples generates specific and relevant data that could be advantageously used for clinical diagnostic purposes. Here we show that amino acid profiling in serum can be achieved in our laboratory with a robust LC-MS based method.